Client Goal
To uncover information about their sales patterns to gain insights and strategize for better customer segmentation.
Project Summary

Overview
Instacart is already a successful online grocery store company and wish to understand more about their sales patterns. Through this exploration, they hope to discover insights to help advance sales and marketing efforts through customer segmentation.
Purpose and Context
This project was built as part of the Career Foundry “Become a Data Analyst” curriculum. The “client” for this fictional project is Instacart and leveraged real company data.
My Role
For this project, I served as a business intelligence analyst. I worked with the data from start to finish, providing the business insights and final report deliverable.
Tools and Analytical Techniques
This project was created with the following tools:
- Microsoft Excel
- Python (including Pandas, NumPy, MatPlotLib, Seaborn, SciPy)


The skills used to complete this project include:
- Data wrangling
- Data merging
- Deriving variables
- Grouping data
- Aggregating data
- Population flows
- Insight development
- Data visualization
- Report development
Project

Project Scope and Planning
Align requirements, project scope, and desired outcomes of project.
The focus of the project was to discover the different types of customers in their database and their purchasing behaviors. In better understanding their customers, they could better target their marketing strategy.
Specifically, I set out to discover:
- Busiest sales days and hours
- Price range groupings and related sales trends
- Department / product popularity
The analysis was designed to inform the marketing strategy by creating customer profiles to drive targeted campaigns.

Data Prep and Exploration
Determine and collect data for project, then profile, clean, and explore.
Given the datasets for this project were provided by Career Foundry, I was able to start with the profile-clean-explore parts of this phase right away.
This phase took the majority of time for this project and proved extremely critical to the analysis and insights that would come later.
Profile
Conducted basic descriptive exploratory tasks to understand dimensions, fields, data types, source, and relevance.
Also, merged department, orders, products, and customer datasets together to prepare for deeper exploration.
Clean
Data cleanup needed to ensure data is ready for analysis:
- Changed data types of variables and renamed columns
- Fixed mixed-type variables
- Addressed missing values and duplicates
- Per request of CFO, removed order information for customers placing less than five orders
Explore
Used various Python functions to start exploring and organizing data:
- Created new dataframe subsets to support analysis
- Derived new variables
- Created flags to start categorizing customer behavior
- Created summary columns with descriptive statistics

Analysis, Insights, and Visualization
Interpret data patterns and trends to uncover most impactful elements for project.
In this phase, there was a heavy focus on exploring data through visualizations to identify relationships and patterns with variables.
Here, I started to explore which variables could be used to segment the customer base based on demographic information.
As the segments were built out, various patterns evolved that could start to shape how these groups could be leveraged in marketing campaigns.
Leveraged MatPlotLib and Seaborn libraries to explore data with:
- histograms
- bar charts
- line charts and
- scatterplots
Here are some of the key insights identified in this phase, answering some primary business questions for the project.
Instacart's Busiest Times
Key Trends:
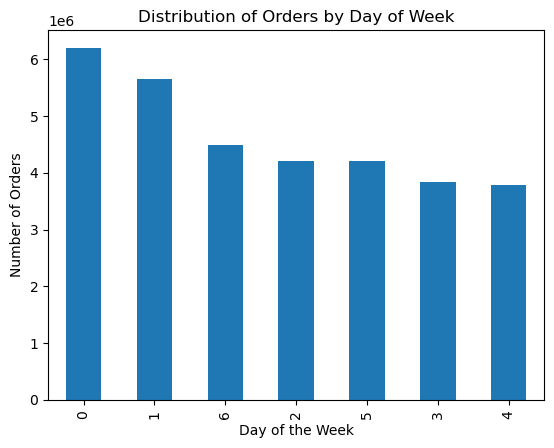
- The busiest days of the week are Saturday and Sunday.
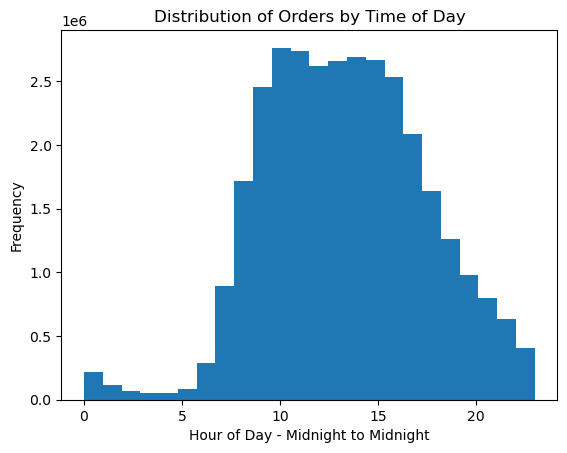
- The busiest hours of the day are daytime hours.
Purchase Timing Trends with Pricing
Key Trends
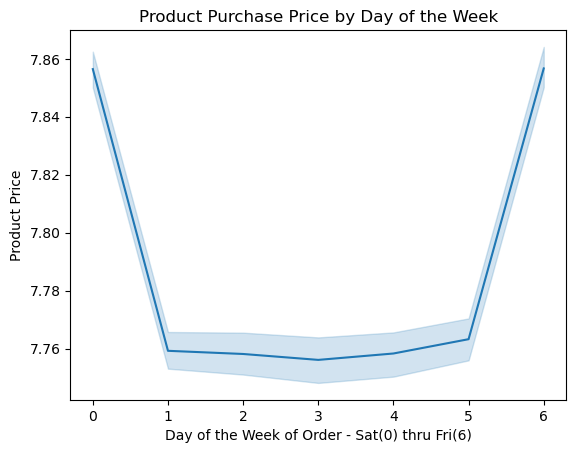
- The highest priced products are purchased on Friday and Saturday.
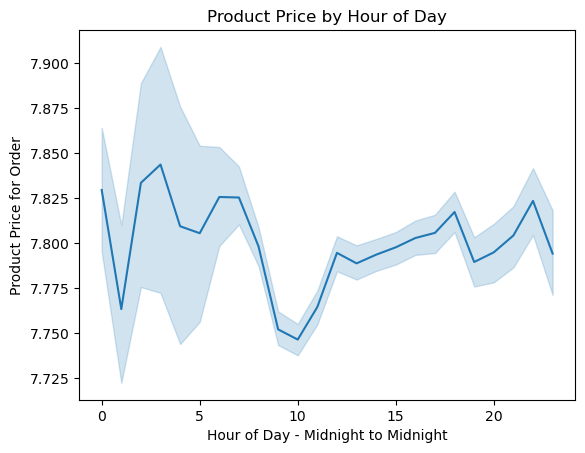
- There is no distinct pattern related to price and time of day. The price of the item purchased varies throughout the day.
Purchasing Trends with Price Points
Key Trends
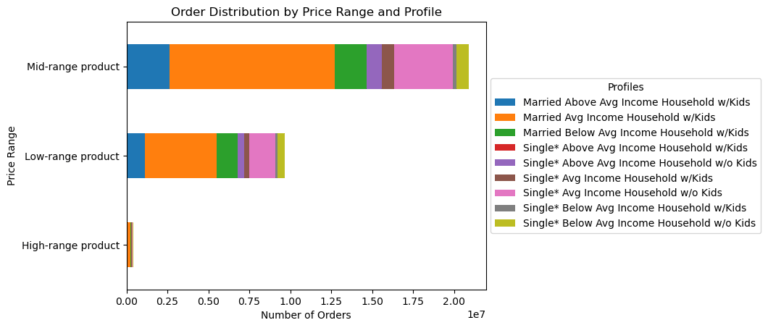
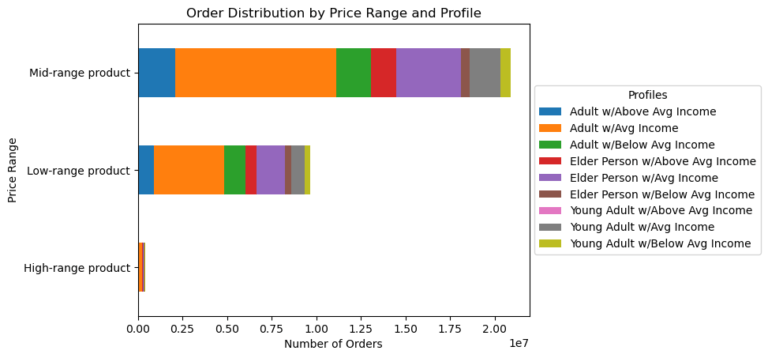
In the analysis, items were categorized as low, medium, or high in price range using breakpoints of $5 and $15.
- There was a clear pattern of mid-range priced items being by far the most purchased items.
- High-priced items were very infrequently purchased.
Department Purchasing Trends
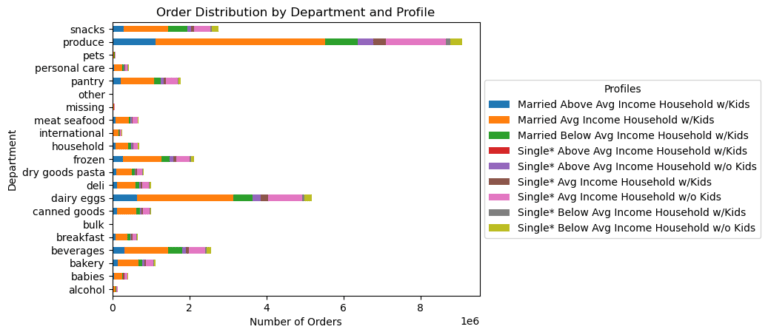
Key Trend: The majority of orders for all customer segments are from the produce, dairy/eggs, snack, and beverage departments.
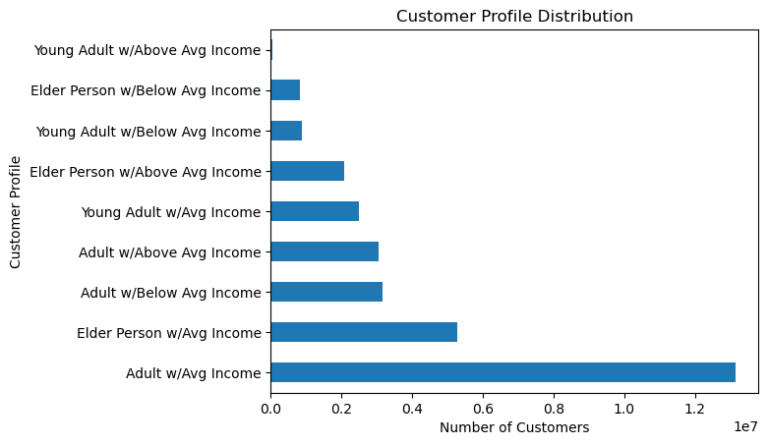
Customer Segment Distribution
Key Trends
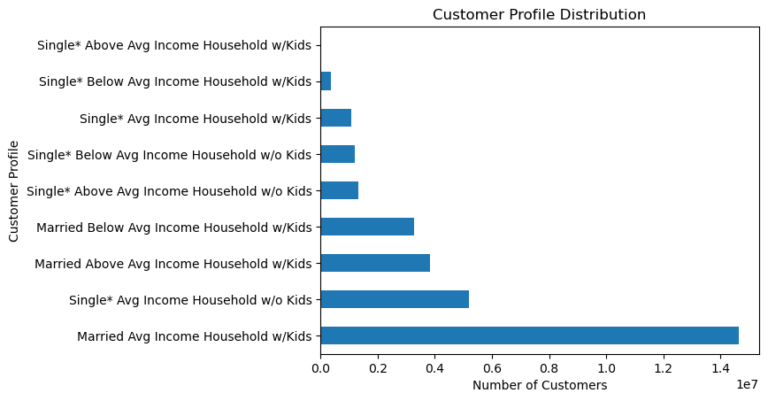
The majority of customers are:
- Married with Children and an Average Income level
- Adults (age 25-64) with Average Income level
Challenges and Decisions in this Phase
- The main challenge in this phase was identifying variables that would be helpful in identifying the various customer segments.
- To address this challenge, I created two segment ccategories that leveraged a few key demographic pieces. The first segment combined marital status, income, and number of children. The second segment combined age and income.
- Between the two segment groups, many key demographic factors were included to provide a broad range of customer types.

Storytelling and Presentation
Assemble actionable recommendations to drive the key outcomes for stakeholder presentation.
In this phase, I assembled the final report showing:
- Analysis methodology
- Various results and insights
- Recommendations identified through the analysis
Final Recommendations
The following were the primary recommendations presented in the final report.
Target weekdays and early mornings for ads to help boost sales during these less busy times.
Run ads and/or offer coupons for higher priced items Sunday through Thursday when sales of these items are less frequent.
Run ads for lower priced items and offer coupons or other incentives on higher priced items to boost sales on these less frequently purchased items.
Run ads for and incentivize purchases in departments with less sales (all departments outside of produce, dairy/eggs, snack, and beverage).
Run ads that target our frequent, but not yet categorized as “loyal” customers. Incentivize their purchases to turn them “loyal.”
Target ads to the customer base in the Northeastern states, where sales are the lowest. Offer incentives to this group to encourage more activity.
Offer incentives to customer segments with the lowest sales: “single with children”, “young adult” and “elder” populations.
Challenges and Decisions in this Phase
- The challenge in this phase was to create a report layout where the recommendations were clear and could be tied back to the insights derived from the analysis. There was a lot of data and visualizations, so to distill it down in a consumable way presented a design challenge.
- My approach was to create a linear layout that tied the business question to the answer and the recommendation. I also made sure that the visualizations associated with the answers were referenced clearly.
- This approach in the layout would make it easy for stakeholders to tie the question to the data so they could follow where the recommendation came from.
Dataset
There were three sources of data for this project.
- The main dataset used for analysis was the “The Instacart Online Grocery Shopping Dataset 2017”.
- The second set of data, customer data, as well as the “prices” column in the Products data set, were both fabricated for the purpose of this project and provided by Career Foundry.
- The third dataset was used to categorize states into regions and that was done using the “List of regions of the United States” from Wikipedia.
Sources
The Instacart data for analysis was pulled from Kaggle on January 2, 2024.
The customer dataset was pulled from Career Foundry.
Data for regional categorization of states was pulled from Wikipedia.


