Client Goal
To learn about flu season trends across states and seasons to support an effective staffing plan for their agency.
Project Summary
Overview
In the United States, there is a season where more people than usual suffer from the flu. Some people, particularly those in vulnerable populations, develop serious complications and end up in the hospital. Hospitals and clinics need additional staff to adequately treat these extra patients. The medical staffing agency provides this temporary staff.
The client-agency covers all hospitals in each of the 50 states in the U.S., and the project helped plan for the upcoming influenza season.
The objective of the project was to determine when to send staff and how many staff to send to each state.
Purpose and Context
This project was built as part of the Career Foundry “Become a Data Analyst” curriculum. The client, a medical staffing agency, is a fictional company. Their challenge, though, is real – how can they leverage data to effectively prepare for flu season.
My Role
For this project, I served as a business intelligence analyst and storyteller. I worked with the data from start to finish, providing the business insights and presentation, as well as sharing insights and recommendations via video recording to stakeholders.
Tools and Analytical Techniques
This project was created with the following tools:
- Microsoft Excel
- Tableau Public
- ScreenPal
- YouTube


The skills used to complete this project include:
- Translating business requirements
- Data cleaning
- Data integration
- Data transformation
- Statistical hypothesis testing
- Visual analysis
- Insight development
- Data visualization
- Presentation development
- Storytelling
- Presenting results to an audience
Project

Project Scope and Planning
Align requirements, project scope, and desired outcomes of project.
The scope of the project included examining trends in influenza across age groups, states, and seasons to use to proactively plan for staffing needs across the country.
To meet the project goal, I planned to:
- Analyze historical data to guide an effective staffing strategy.
- Confirm effective prevention methods to reduce the need for additional staff by reducing hospitalizations and flu-related deaths.

Data Prep and Exploration
Determine and collect data for project, then profile, clean, and explore.
Given the datasets for this project were provided by Career Foundry, I was able to start with the profile-clean-explore parts of this phase right away.
Profile
Conducted basic descriptive exploratory tasks to understand dimensions, fields, data types, sources, and relevance.
I also did a review of the data quality to assess what kind of cleaning and transformation may be needed.
Clean
Various types of cleanup and transformation were needed to ensure data was ready for analysis. This included but was not limited to the following.
Influenza deaths by geography dataset cleanup included:
- replaced all state acronyms with full names for consistency
- fixed a data error of 20133 for a year, changed to 2013
Population data cleanup included:
- replaced all “?” and sigma symbols with letters in county names
- removed any duplicate years to ensure no county had more than nine line items (matching the number of years in the data set)
- rounded all numbers to whole numbers so they were representative of a whole person not a partial person for population count
Explore
The extensive exploration phase included:
- Reviewing data profiles after cleaning for readiness and any initial trends or patterns that could be of interest
- Calculation of variance and standard deviation for key variables.
- Identifying variables with a potential relationship to test for correlation.
Challenges and Decisions in this Phase
- There was a large amount of missing data in the flu deaths data. About 82% of the data was “suppressed” – most of this information was data for the <5 age category, limiting the amount of analysis that could be performed on this vulnerable population. No action taken to impute or otherwise adjust data sets due to large amount of missing information. For this reason, the focus of the hypothesis testing and final presentation, the <5 age group was not included as a “vulnerable” population and focused solely on the elder 65+ population.
- There was a large amount of missing data in the census information – each county should have had nine years of data but some had less. About 11% of the data was missing overall. No action taken to impute or otherwise adjust data sets due to large amount of missing information and analysis was completed on a state level, so data was combined to provide a larger picture anyway.

Analysis, Insights, and Visualization
Interpret data patterns and trends to uncover most impactful elements for project.
During this phase, work was completed to build out the key insights that would contribute to the conclusions and recommendations for stakeholders.
Focus was given to answering three core questions to provide the agency with what they needed to intelligently staff for the coming flu season.
Three Core Questions
WHEN
to allocate staff?
WHERE
to allocate staff?
HOW MANY
staff are needed?
When to allocate staff?
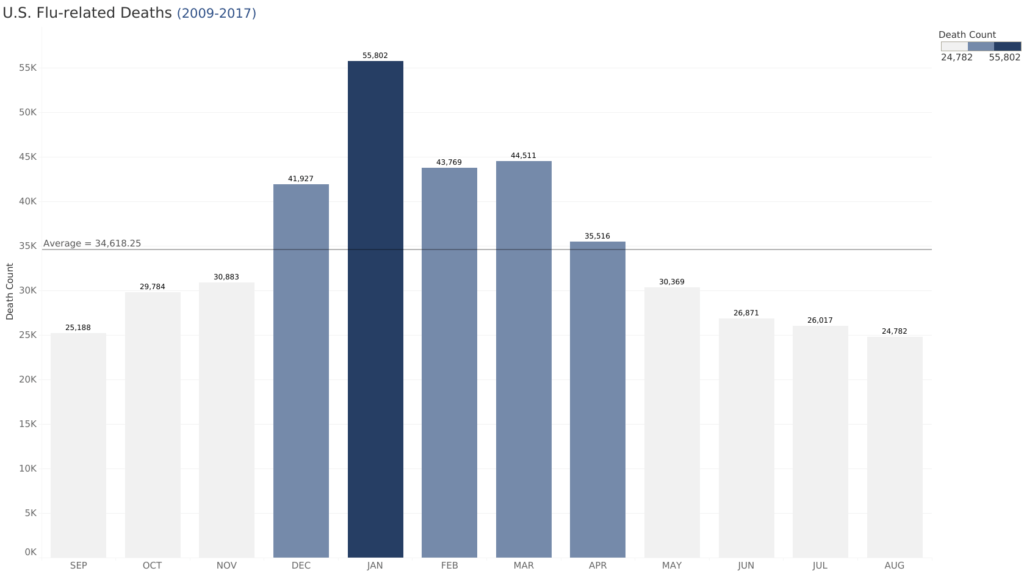
To understand this, I needed to uncover when the staffing need was the greatest. I did this by answering the question: when is flu season?
Various visual analyses were completed to answer this question.
- bar chart
- line chart
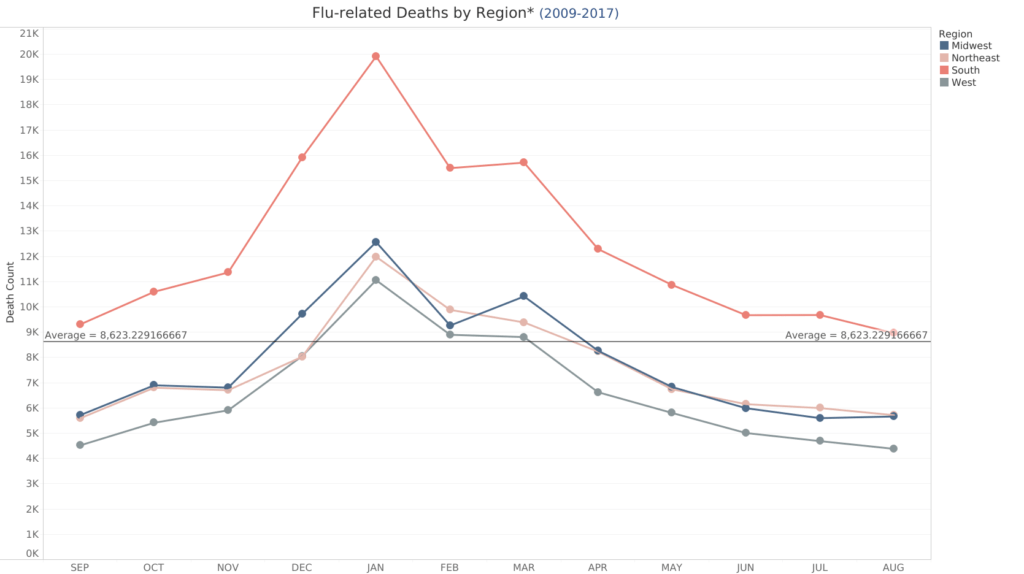
The largest death counts in looking at all states occurred in wintery months from December to April, indicating when flu season generally occurs.
However, when filtered by individual states, the most affected months tended to vary. For instance, when states were broken down by region, southern states showed a pattern of above average death rates throughout the year.
Key Insights
- Focus on winter-type months from (approximately December through April) but tailor staff allocation by state.
- Provide deliberate coverage in southern states, based on above-average flu deaths throughout the year.
Where to allocate staff?
As staffing resources are limited, an effective strategy would place staff where they were most needed.
Various statistical and visual analyses were completed to explore this question, broken down into two parts.
Which age group is most vulnerable to flu death?
In which states do most flu deaths occur?
Hypothesis Testing
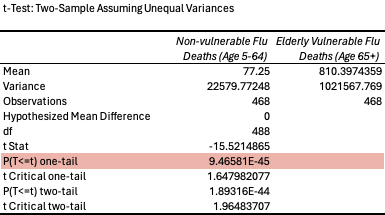
As part of my statistical examination, I tested a hypothesis against two age groups – the vulnerable, elderly (65+) group against the non-vulnerable (5-64) group. This test was to see if age had an effect on the likelihood that a patient would die of the flu.
Following the analysis, I had enough evidence to conclude that the two populations compared (age groups) were significantly different as it relates to their likelihood of flu death.
Conclusion: Age DOES impact the chances that a person will die of the flu.
Visual Analyses
Various visual analyses were used to discover any patterns or trends to reveal the most vulnerable population.
- pie chart
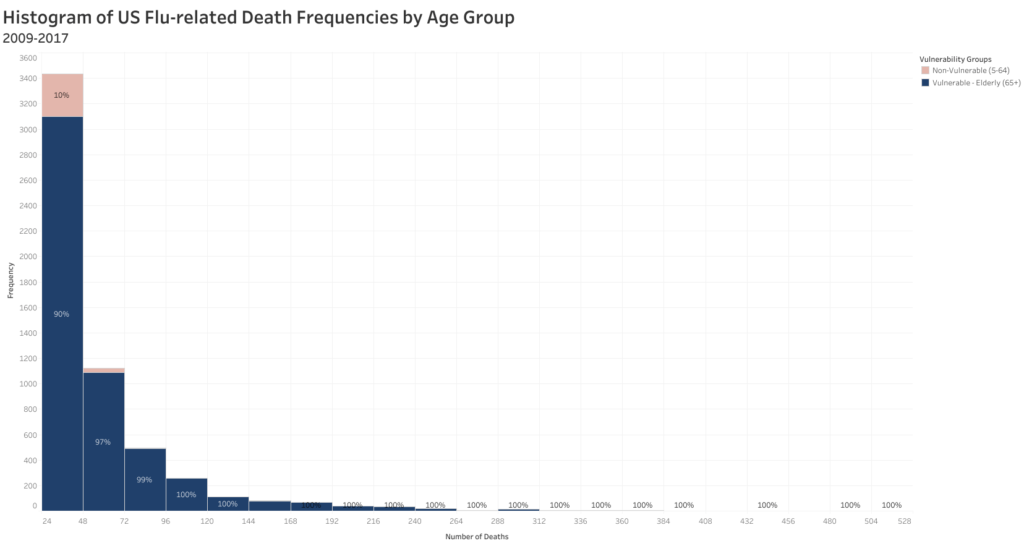
- histogram
- box + whisker plot
- scatterplot
- bubble chart
All revealed the same pattern – flu deaths are highest in the elderly (65+) age group.*
Various visual analyses were also used to discover any patterns or trends to reveal which states had the highest flu death rates.
- bar charts
- treemaps
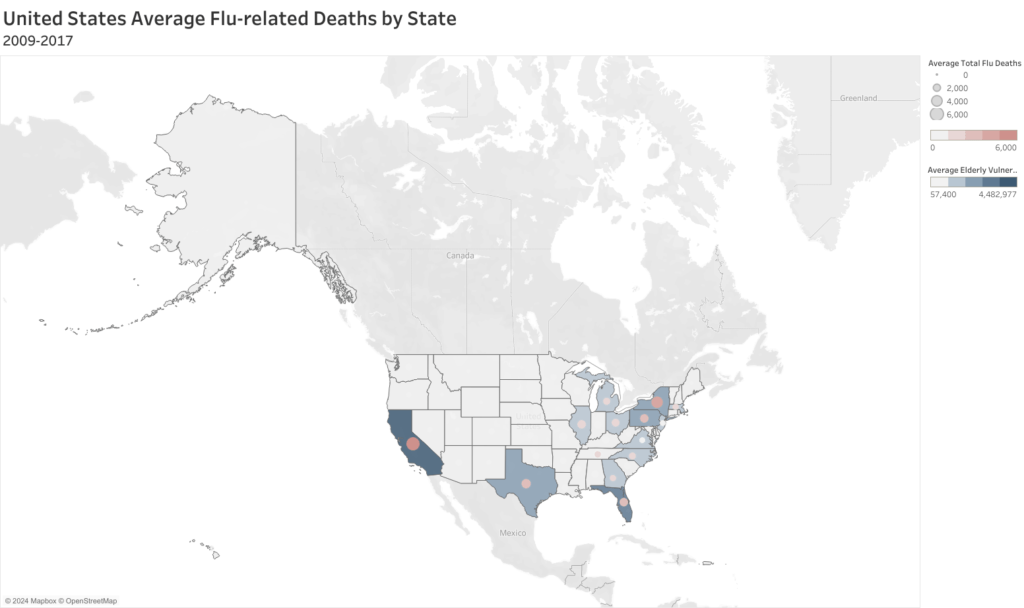
- spatial/map
States such as California, New York, Florida, Texas, and Pennsylvania had the highest flu death rates.
Not surprisingly, these states also had the highest elderly population counts.
Key Findings
- The elderly (aged 65+) are most susceptible to flu death and therefore the most vulnerable.
- The highest flu death rates are found in the states of California, New York, Florida, Texas, and Pennsylvania.
Risk Assessment
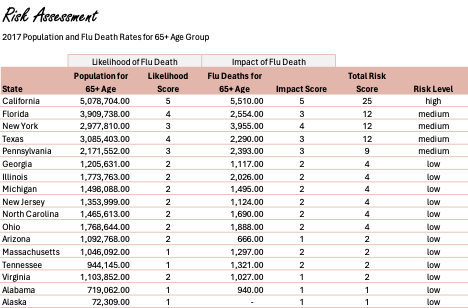
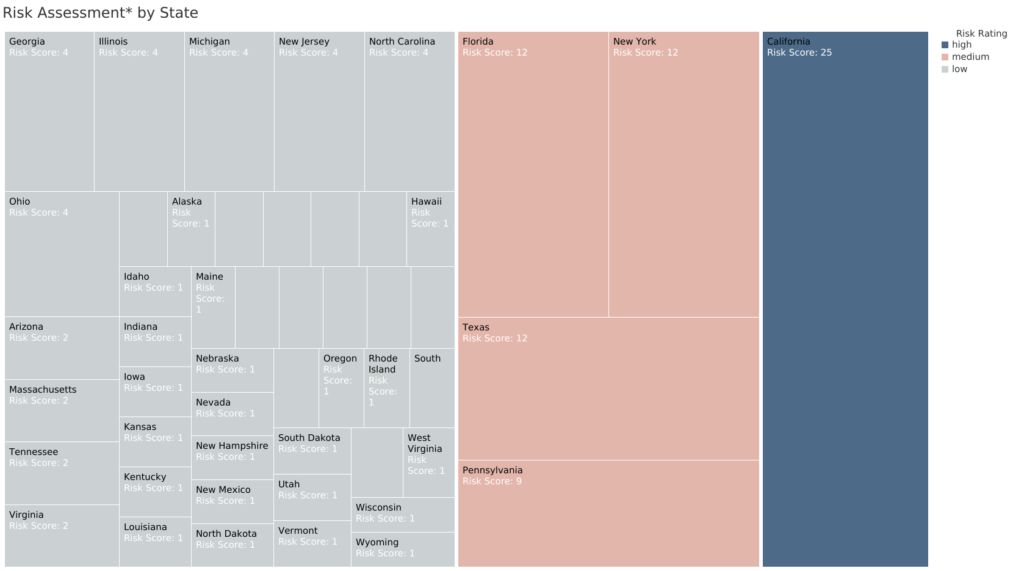
To provide the most strategic staffing allocation, I wanted to conduct a risk assessment by state*. This would ensure that any recommendation would prioritize the greatest need.
To provide the risk rating, I scored each state on a scale of 1-5 in two areas:
- the likelihood of flu death for the elder 65+ population where the rating reflected the size of the vulnerable population and
- the impact of flu death for the elder 65+ population where the rating reflected the number of flu deaths in that vulnerable population.
After rating each state in these two areas, I multiplied the two scores to get their overall risk rating and then categorizing each state as follows.
- High Risk = 15-25
- Medium Risk = 5-12
- Low Risk = 1-4
*Assessment completed using most recent population and flu death rates by state from 2017.
Key Finding: The most at-risk states are California (high) and Florida, New York, Texas, and Pennsylvania (medium).
How many staff to allocate?
No analysis completed to answer this final question as additional data and information was needed.
The list of additional information needed was included in the “Next Steps” portion of the stakeholder presentation.
Additional Actionable Insights from Analyses
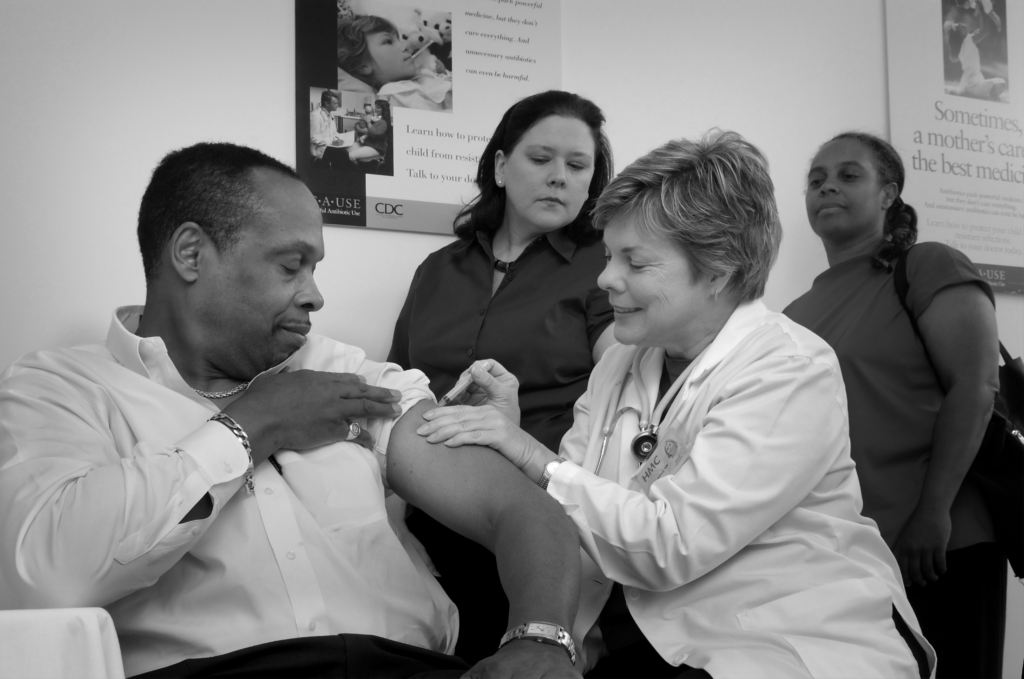
As flu-related deaths are more likely in the elder 65+ population, it would be helpful to support measures that would prevent the elder population from contracting flu in the first place.
That is to say that targeted prevention measures (such as the flu vaccine and educational campaigns) could help reduce flu-related deaths.
Challenges and Decisions in this Phase
- One of the challenges in this phase was categorizing risk for each state as low, medium, or high. The method I used leveraged a 5×5 risk matrix measuring probability (likelihood) against severity (impact).
- It was also challenging to sort through all the visualizations to select which would be most effective. In the end, I chose the visualizations that best aligned with the story for the presentation and clearly demonstrated the insights and recommendations.

Storytelling and Presentation
Assemble actionable recommendations to drive the key outcomes for stakeholder presentation.
With the key insights uncovered, the story came together to answer the key questions in support of the project goals and form what would be needed to finalize the project and analysis.
To wrap this portion of the project, I made a video presentation for stakeholders to provide an update on current progress.
Conclusions
The most effective strategy will combine what was uncovered about flu season timing and the states’ risk level.
The most significant insights included:
- Flu season generally peaks from December through April but varies by state, so staff should be allocated differently based on each state’s peaks.
- Our most vulnerable group is the elder (65+) population and states should be prioritized in staffing and prevention measures based on this population’s count.
- The states of California, Florida, New York, Texas, and Pennsylvania should be prioritized based on their risk levels (related to their 65+ population).
Recommendations
Based on the initial assessment, we can drive the project’s objectives as follows.
Staffing
- Combine the timing of each state’s flu season with the weight of the state’s risk to allocate staffing.
- Continue analysis to finalize staffing plan with specific numbers to meet state requirements and within planned budgets.
Prevention
- Consider the most vulnerable age groups and at-risk states/areas to target prevention campaigns.
- Continue exploration of most effective prevention methods to prevent illness and therefore reduce future staffing needs.
Next Steps
To finalize the staffing plan and an effective prevention strategy, more information is needed.
Staffing
- Required staff-to-patient ratios by state.
- Historic staffing ratios and hospitalization durations for flu-related intake by month/state.
- Number of staff available across facilities, pay rates, and budget.
- Analysis on most effective staffing ratios to support recovery and prevent flu-related death.
Prevention
- Additional data on death rates (<5 age group) and flu shot rates.
- Analysis on effectiveness of flu shot and other preventative methods specific to vulnerable populations.
Dataset
There were two sets of data used for this project.
- The first dataset covered influenza deaths by state from 2009-2017 and was sourced from the Centers for Disease Control and Prevention (CDC).
- The second dataset provided population estimates from different age groups across states from 2009-2017 and was sourced from the U.S. Census Bureau.
Additional potential datasets were provided for the project but were not used.
Sources
The flu death dataset used was pulled from the CDC website.
The population dataset used was sourced from the US Census Bureau.
The regional information used to categorize each state was sourced from the US Census Bureau.


