Client Goal
To intelligently allocate budget for marketing and development as they enter the market as a new business.
Project Summary

Overview
GameCo is a new gaming company. As they looked to allocate their marketing budget and plan their development projects, they were interested in historic market trends to inform their decisions.
Purpose and Context
This project was built as part of the Career Foundry “Become a Data Analyst” curriculum. The client, GameCo, is a fictional company. Their challenge, though, is real – how can a new company leverage data to set itself up for success.
My Role
For this project, I served as a business intelligence analyst and storyteller. I worked with the data from start to finish, providing the business insights and presentation, as well as sharing insights and recommendations with the executive team.
Tools and Analytical Techniques
This project was created with the following tools:
- Microsoft Excel
- Microsoft PowerPoint


The skills used to complete this project include:
- Exploratory analysis
- Data cleaning
- Grouping and summarizing data
- Pivot tables, creating new variables
- Descriptive analysis
- Insight development
- Data visualization
- Presentation development
- Storytelling
Project

Project Scope and Planning
Align requirements, project scope, and desired outcomes of project and then develop a plan.
The executive team at GameCo challenged me to address some key areas of interest:
- Game genre popularity
- Publisher competition in various markets
- Sales trends across markets
The focus of the analysis project was to provide insight on these topics and make recommendations to help focus marketing and development budgets for 2018. It also included addressing an assumption that game sales have been steady across time.

Data Prep and Exploration
Determine and collect the data needed for the project, then profile, clean, and explore it.
As the data for the project was provided by the Career Foundry program, I could move forward right away with the profile-clean-explore portions of this phase.
Profile
Reviewed data to understand dimensions, fields, data types, source, and relevance.
Uncovered data limits and gaps:
- Data only included sales if the game sold more than 10,000 copies
- Sales was only in units sold vs monetary
- Unclear definition of “0” values
- Potential bias in categorization of region/market
Clean
Data cleanup needed to ensure data is ready for analysis:
- Extraneous data points
- N/A values
- Duplicates
- Inconsistent/inaccurate data
Explore
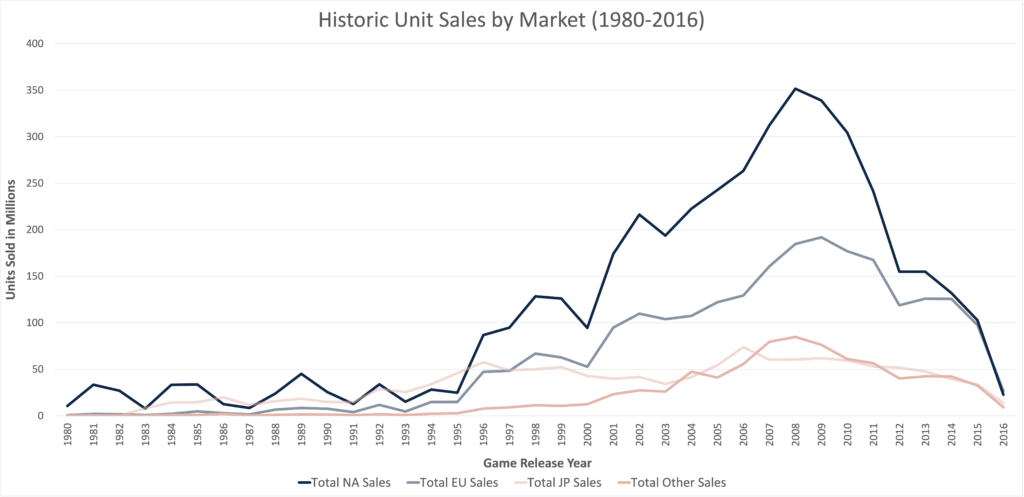
Initial observations debunked executives’ perception that sales have remained consistent throughout the years across markets.
See Figure 1 – “Historic Unit Sales by Market” chart below.
With assumptions negated, insights would be particularly critical to provide a new level of understanding of market.
Challenges and Decisions in this Phase
- For the “Other Sales” column, the imputation accounted for 3% of the data, which gave me pause. As this was part of the project instructions, I proceeded, but would likely consult with a manager to gain approval for this. The value imputed (0.05) was small enough to provide comfort.
- Extraneous data outside of the 2016 end date for the analysis were removed to ensure results weren’t skewed with incomplete year information.
- Lines with “N/A” for genre, year, and geography were removed (a small sample) as there was no way to impute and removal did not significantly affect analysis.

Analysis, Insights, and Visualization
Interpret data patterns and trends to uncover the most impactful elements for the project objectives.
In this phase, I spent time:
- Analyzing the data through statistical analysis such as discovering central tendencies, spread, variance, standard deviation, distribution, IQR, and outliers.
- Manipulating and visualizing the data using pivot tables, filtering, sliders, calculated fields, and charts like histograms.
Through these analyses and visualizations, I identified the most crucial and impactful patterns that would drive the business insights to build out recommendations for the stakeholders.
The key trends – which would drive the recommendations – revolved around:
- Market Variance
- Genre Interest and
- Industry Competition
Market Variance
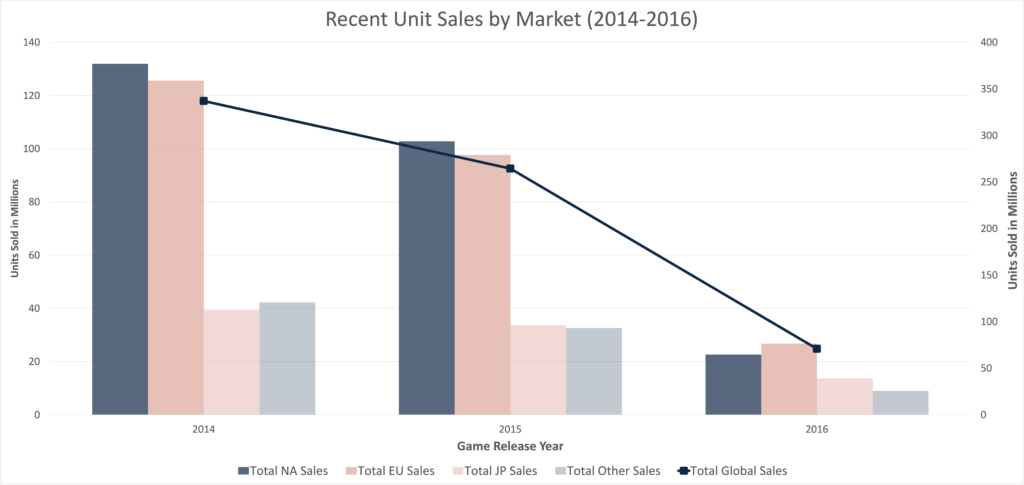
Key Trend: In focusing on recent years (2014-2016), there had been a shift in both global market sales volume overall and in specific market dominance.
Key Insights
- Global sales had gone down and market share is more balanced
- North American and European market sales had been trending down and dropped significantly from 2015 to 2016
- The EU now had the highest sales across all markets
- Other market sales had dipped drastically.
Genre Interest
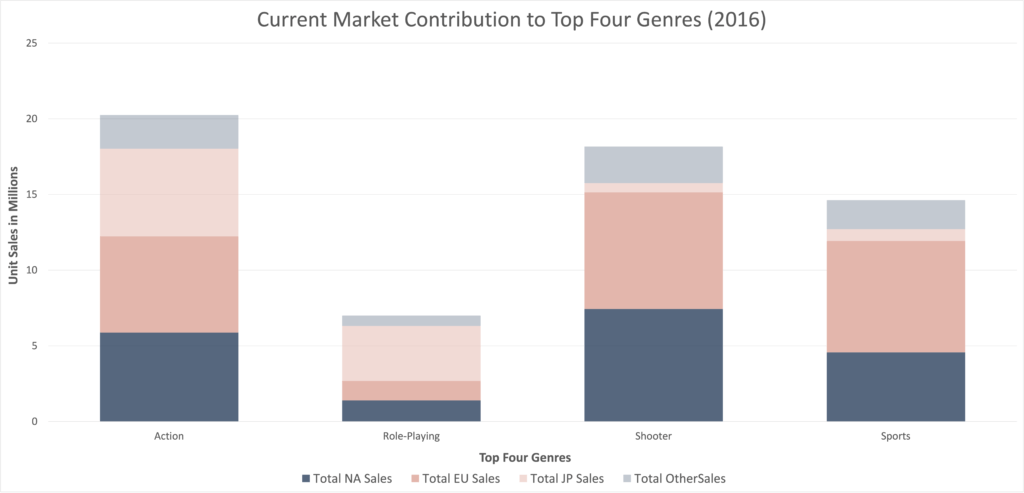
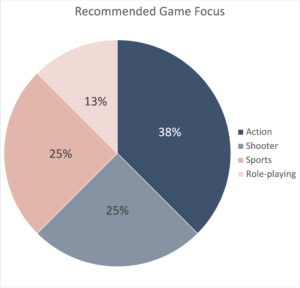
Key Trend: Currently, the top four game genres – action, role-playing, shooter, and sports – are significant drivers in all three major markets.
Key Insights
- Action games generated the highest sales across all markets in 2016 with similar sales in each primary market.
- Shooter and sports games also showed high sales overall with significant interest in both the NA and EU markets.
- Role-playing games, while lowest generating among the top four genres, generated significant interest in the JP market.
Industry Competition
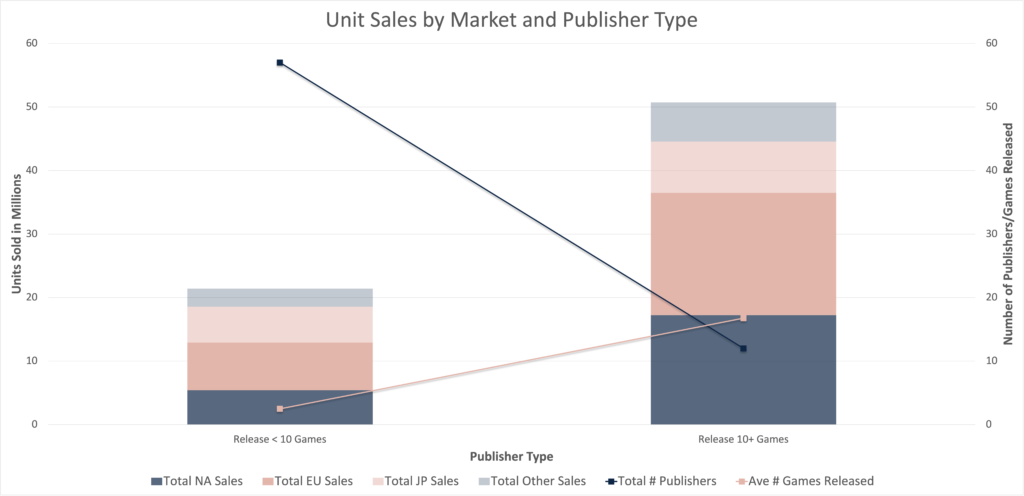
Key Trend: Active publishers (releasing games) vary each year as different publishers enter, exit, and sometimes re-enter the market.
Key Insights
- The amount of competition (active publishers) varied by market.
- Total unit sales were greater for publishers that released 10+ games.
- On average, those publishers released 17 games in 2016.
Challenges and Decisions in this Phase
- Outliers in the sales for North America made up 10% of the data points, so I decided to keep the data in the analysis as it would skew results more adversely if they were removed. These outliers were not considered odd but rather part of the actual sales pattern, which was interesting in itself.
- One of the challenges was in identifying competition. Since companies don’t always stay in the market or release games each year, it was difficult to identify specific competitors. I chose to focus on most recent years and identify which factors (such as region and # of games put out) made them most successful.

Storytelling and Presentation
Assemble actionable recommendations to drive key outcomes for stakeholder presentation.
Here is where the project came together.
By pulling out the most important insights and observations, a story evolved. In applying those insights to GameCo’s goals, I was able to make data-driven recommendations to form the initial strategy for marketing and development.
Final Recommendations
By leveraging historical sales data to understand the competition, geographical patterns, and genre trends, GameCo could optimize its return on investment from inception.
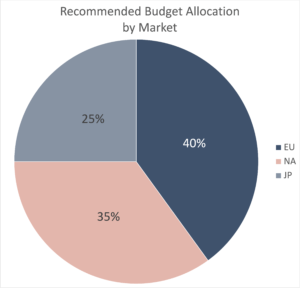
- Maximize ROI by focusing 2018 marketing budget across three primary markets with a focus on four genres that generate the most unit sales.
- Aim towards releasing 10+ games per year as development schedule and budget allows.
Strategic Logic Behind Recommendations
Allocate majority (75%) of budget to two largest markets (EU/NA), with a slight tip towards the EU as they were the primary consumer as of 2016.
- Will contribute to sales in three of four top genres
- Have the lowest number of competitors
Allocate smaller portion (25%) of budget towards smaller JP market.
- Will contribute to sales in two of four top genres
- Has the highest number of competitors
By aiming to release 10+ games per year, GameCo maximizes its reach across the markets and genres.
Additional Recommenations
While this project helped provide insight to build the budget and strategic plan for GameCo going into 2018, this was just the start for the company.
The following additional recommendations were included:
- Re-evaluate market regularly to shift marketing focus with trend.
- Consider expanding budget to other genres and secondary markets as company grows.
Challenges and Decisions in this Phase
The biggest challenge in this phase was in how to translate the insights from the analysis into a budget recommendation.
- I used a grid to cross the prioritization of genre and market, assigning a weight to each based on prominence.
- The summed weights translated to budget percentages used in the final recommendations.
Dataset
The data used for this project covered historical sales of video games (for games that sold 10,000+ copies) across various platforms, genres, and publishing studios from 1980-2016.
The year associated with each game is the year the game was released for purchase.
Source
Data was pulled from the VGChartz website.
Collection Method
To see how the data was collected, view the VGChartz methodology.


